Q&A 11 How do you visualize the expression of two or more genes across conditions using R?
11.1 Explanation
Sometimes, you want to inspect the expression patterns of specific genes of interest — such as those that appear highly upregulated or downregulated in your DESeq2 results.
By selecting two or more genes and reshaping the rlog-transformed matrix into a tidy long format, you can easily create grouped boxplots, violin plots, or faceted charts. These plots help validate patterns visually and are useful for presentations or downstream interpretation.
11.2 R Code
library(tidyverse)

# 📥 Load transformed matrix and metadata
rlog_mat <- read_csv("data/rlog_matrix.csv") |>
  column_to_rownames("gene") |>
  as.matrix()

metadata <- read_csv("data/demo_metadata.csv")

# 🎯 Select two genes
genes_to_plot <- c("Gene5", "Gene12")

# ✅ Check genes exist
missing_genes <- setdiff(genes_to_plot, rownames(rlog_mat))
if (length(missing_genes) > 0) stop(paste("Missing genes:", paste(missing_genes, collapse = ", ")))

# 🧾 Create tidy dataframe for ggplot
plot_df <- rlog_mat[genes_to_plot, ] |>
  as.data.frame() |>
  rownames_to_column("gene") |>
  pivot_longer(-gene, names_to = "Sample", values_to = "Expression") |>
  left_join(metadata, by = "Sample")

# 📊 Boxplot with multiple genes
ggplot(plot_df, aes(x = condition, y = Expression, fill = condition)) +
  geom_boxplot(width = 0.5, alpha = 0.7, outlier.shape = NA) +
  geom_jitter(width = 0.2, size = 1.5, alpha = 0.6) +
  facet_wrap(~gene, scales = "free_y") +
  labs(title = "Expression of Selected Genes",
       x = "Condition", y = "Rlog Expression") +
  theme_bw() +
  theme(legend.position = "none")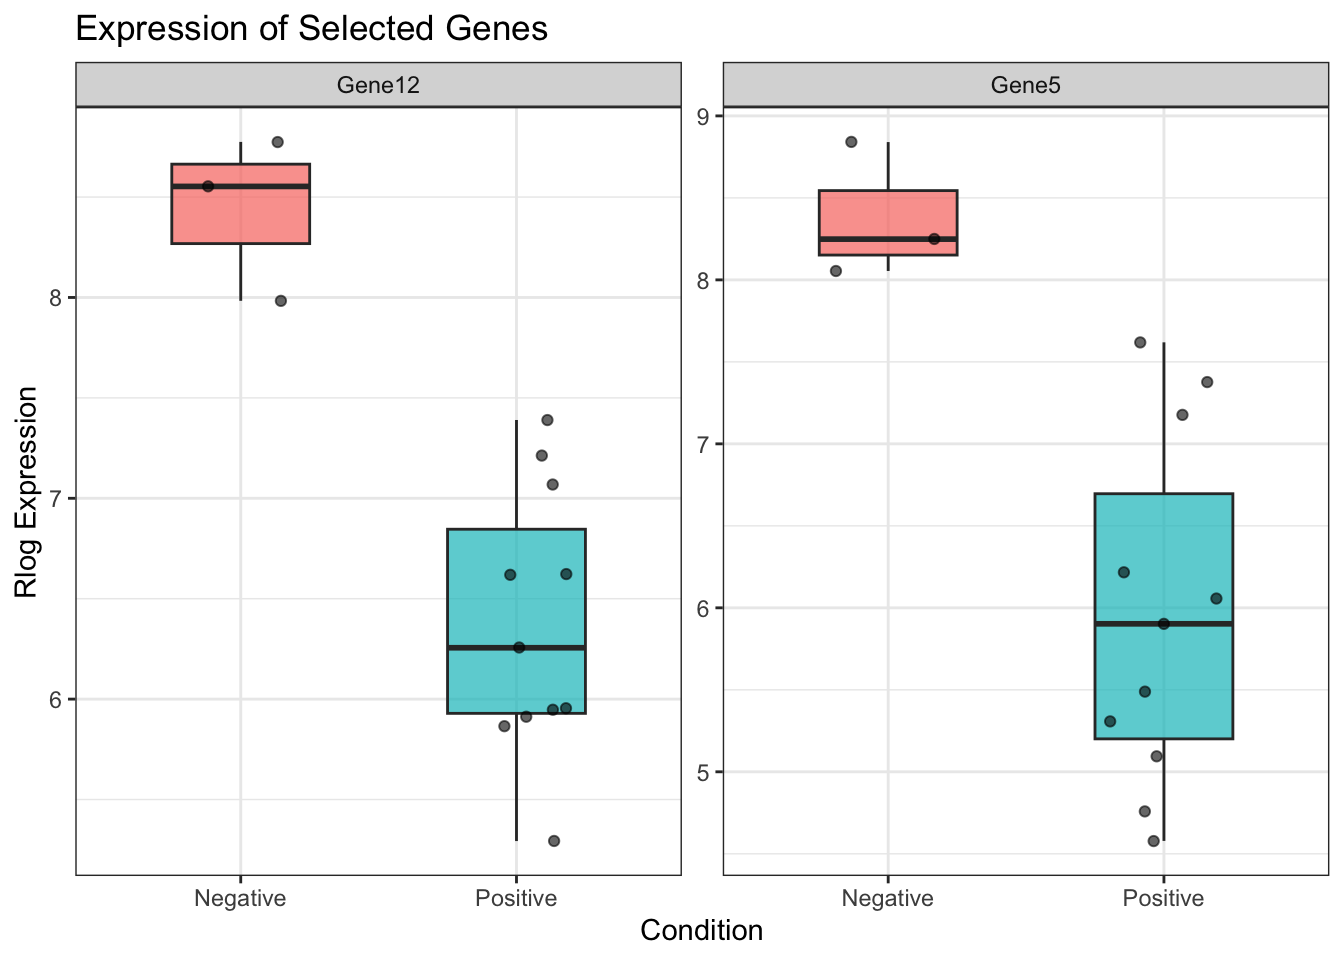
✅ Takeaway: Visualizing individual gene expression helps verify and communicate biological differences.
📌 This approach usesfacet_wrap()to display each gene’s distribution across conditions in its own panel, making it easy to compare across genes and conditions.