Q&A 10 How do you visualize the expression of a single gene across conditions using R?
10.1 Explanation
To explore how a specific gene behaves across experimental conditions, a boxplot of rlog-transformed expression values can provide insight into group differences and variability.
This is useful for:
- Validating top hits from DE results
- Highlighting genes of interest
- Creating publication-ready visual summaries
We’ll visualize Gene5 as an example.
10.2 R Code
library(tidyverse)

# 📥 Load rlog-transformed expression matrix
# 📥 Load rlog-transformed expression matrix
rlog_mat <- read_csv("data/rlog_matrix.csv") |>
  column_to_rownames("gene") |>
  as.matrix()

# 📥 Load metadata
metadata <- read_csv("data/demo_metadata.csv")

# 🎯 Select one gene
gene_to_plot <- "Gene5"

# 🧪 Check gene exists
if (!gene_to_plot %in% rownames(rlog_mat)) stop("Gene not found in rlog matrix.")

# 🧾 Create dataframe for plotting
plot_df <- tibble(
  Expression = rlog_mat[gene_to_plot, ],
  Sample = colnames(rlog_mat)
) |>
  left_join(metadata, by = "Sample")

# 📊 Boxplot
ggplot(plot_df, aes(x = condition, y = Expression, fill = condition)) +
  geom_boxplot(width = 0.5, alpha = 0.7, outlier.shape = NA) +
  geom_jitter(width = 0.1, size = 2, alpha = 0.7) +
  labs(title = paste("Expression of", gene_to_plot),
       x = "Condition", y = "Rlog Expression") +
  theme_minimal() +
  theme(legend.position = "none")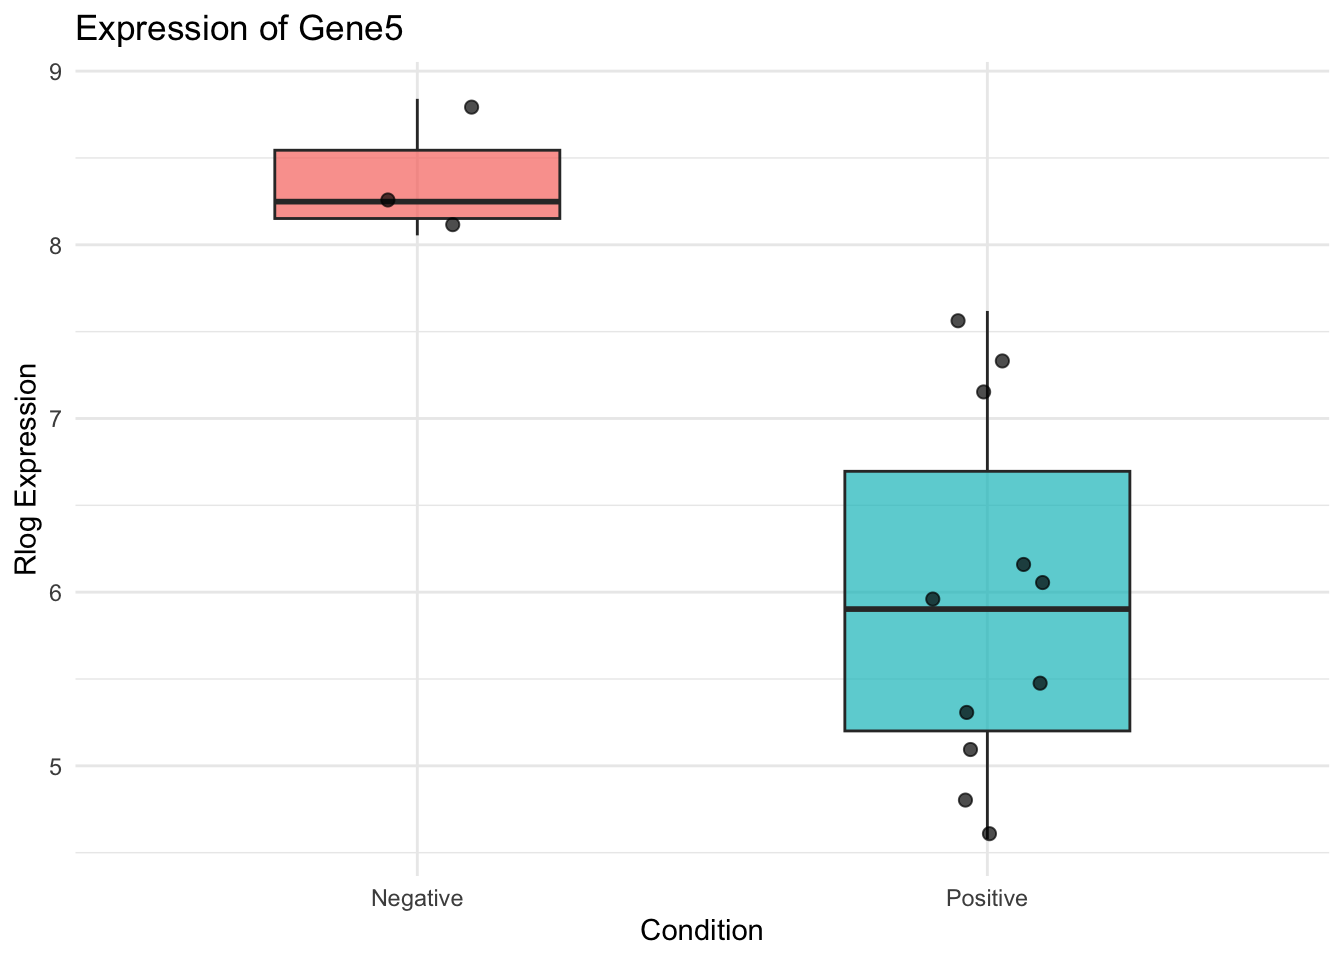
✅ Takeaway: Boxplots of individual genes help confirm biological patterns and support gene selection for follow-up experiments or reporting.